The Gravestone Doji is a powerful candlestick pattern in technical analysis, often signaling a potential bearish reversal in the market. Characterized by a long upper shadow and little to no lower shadow, this pattern suggests that buyers initially pushed prices higher, but sellers regained control, driving the price back down to the opening level. Traders use the Gravestone Doji to identify shifts in market sentiment and make informed trading decisions. In this comprehensive guide, we will explore its formation, meaning, trading strategies, and how to integrate it into your technical analysis toolkit for forex, stocks, and crypto trading.
Table of Contents
What's the Opposite of a Gravestone Doji?
How is the Gravestone Doji Candlestick Pattern Formed?
When Does a Gravestone Doji Candlestick Happen?
How to Read a Gravestone Doji Candlestick in Technical Analysis?
When is the Best Time to Trade Using a Gravestone Doji Candlestick?
How to Use the Gravestone Doji in a Trading Strategy?
The Different Types of Doji Patterns
What Candlestick Pattern is Similar to a Gravestone Doji?
The Gravestone Doji Pattern – Pros and Cons
Key Takeaways
- Definition: A gravestone doji is a bearish reversal candlestick pattern characterized by a long upper shadow and little to no lower shadow, with the open, close, and low prices near the same level.
- Significance: It indicates that buyers pushed prices higher during the session, but sellers regained control, bringing the price back down to the opening level, suggesting a potential reversal.
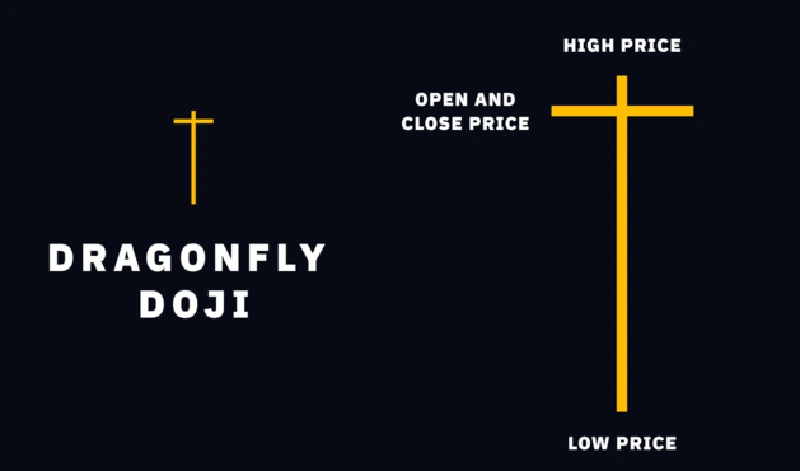
- Opposite Pattern: The dragonfly doji is the opposite, featuring a long lower shadow and signaling a potential bullish reversal.
- Formation: Occurs when the open, low, and close prices are at or near the same level, with a significant high during the session forming a long upper shadow.
- Reliability: While it can be a strong indicator of a reversal, it's essential to confirm the pattern with additional technical indicators or subsequent price action.
What Is a Gravestone Doji?
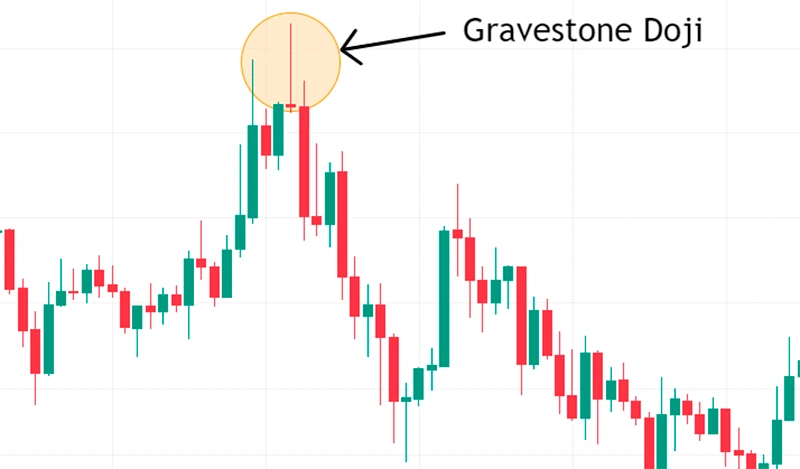
A Gravestone Doji is a bearish reversal candlestick pattern that signals a potential shift in market momentum from bullish to bearish. It forms when the opening, closing, and low prices are at or near the same level, while the session's high is significantly above these levels, creating a long upper shadow. This distinctive shape resembles an inverted “T”, indicating that buyers attempted to push prices higher, but sellers eventually regained control and forced the price back down.
The psychology behind the Gravestone Doji suggests that during the trading session, bulls initially dominated, driving the price upward. However, their strength was short-lived as bears took over, erasing all gains by the session’s close. The failure of buyers to maintain higher prices creates a strong bearish signal, especially when the pattern appears after an uptrend.
Key Characteristics of a Gravestone Doji:
- Open, close, and low prices are nearly identical.
- Long upper shadow indicates significant rejection of higher prices.
- No (or very small) lower shadow, reinforcing the loss of bullish momentum.
- Typically found at the top of an uptrend, signaling a potential trend reversal.
Since the Gravestone Doji lacks a real body, it represents a point of indecision where bullish momentum fails, and sellers ultimately take control. While it often suggests a downward reversal, traders should seek confirmation from subsequent candlestick patterns or technical indicators before making trading decisions.

What Does a Gravestone Doji Tell You?
The gravestone doji indicates that during the trading session, buyers managed to push the price significantly higher, but by the end of the session, sellers had driven the price back down to the opening level. This shift suggests that the bullish momentum has weakened, and a bearish reversal may be imminent.
What's the Opposite of a Gravestone Doji?
The opposite of a Gravestone Doji is the Dragonfly Doji, a candlestick pattern that signals a potential bullish reversal. While both are classified as doji candlesticks, their formations and market implications are significantly different.
Key Differences Between Gravestone Doji and Dragonfly Doji
| Feature | Gravestone Doji | Dragonfly Doji |
| Shadow Formation | Long upper shadow, no lower shadow | Long lower shadow, no upper shadow |
| Price Movement | Buyers initially pushed prices higher but lost control to sellers | Sellers initially pushed prices lower but lost control to buyers |
| Market Sentiment | Bearish reversal signal | Bullish reversal signal |
| Typical Occurrence | Appears at the top of an uptrend | Appears at the bottom of a downtrend |
Understanding the Dragonfly Doji Pattern
A Dragonfly Doji forms when:
- The open, close, and high prices are nearly identical.
- The price moves significantly lower during the session, forming a long lower shadow.
- By the end of the session, buyers step in, pushing the price back up to the opening level.
This formation suggests that sellers dominated early on, but bullish momentum increased, leading to a strong recovery by the close. The long lower shadow reflects rejection of lower prices, hinting at a potential trend reversal to the upside.
How Traders Use the Dragonfly Doji
Traders interpret the Dragonfly Doji as a bullish signal, especially when it appears:
- At the bottom of a downtrend → Suggests a reversal to an uptrend.
- Near a support level → Indicates strong buying interest at lower price points.
- With confirmation from subsequent bullish candles → Strengthens the reliability of the pattern.
Comparing Market Sentiment
| Scenario | Gravestone Doji (Bearish) | Dragonfly Doji (Bullish) |
| Formation Context | Appears after an uptrend, signaling a potential reversal downward | Appears after a downtrend, signaling a potential reversal upward |
| Buyer-Seller Battle | Buyers initially pushed prices up, but sellers took control and erased gains | Sellers initially drove prices down, but buyers stepped in and regained control |
| Market Emotion | Bearish dominance and loss of bullish strength | Bullish dominance and rejection of lower prices |
Trading Implications
- A Gravestone Doji warns traders of weakening bullish momentum, prompting them to look for shorting opportunities if confirmed by other indicators.
- A Dragonfly Doji, on the other hand, suggests a shift from bearish to bullish sentiment, encouraging traders to look for buying opportunities upon confirmation.
Since both doji patterns reflect market indecision, it’s crucial for traders to wait for additional confirmation before making a trading decision. A bullish candle after a Dragonfly Doji or a bearish candle after a Gravestone Doji increases the pattern’s reliability.
How is the Gravestone Doji Candlestick Pattern Formed?
The Gravestone Doji forms under specific market conditions during a trading session, making it a key indicator of bearish reversals. The pattern appears when the open, low, and close prices are at or near the same level, creating a very small or non-existent real body. At the same time, the high price reaches a significantly higher level than the open, forming a long upper shadow. This upper shadow visually represents the market's attempt to push higher before facing strong resistance. The absence of a lower shadow suggests that there was little to no downward movement during the session, emphasizing that sellers ultimately overpowered buyers.
This formation reflects a classic battle between buyers and sellers. At the beginning of the session, buyers dominate, driving prices higher as demand increases. However, as the session progresses, sellers step in with significant force, reversing the gains and pulling the price back down to its opening level. This price action signals a failure of bullish momentum, indicating that sellers are regaining control. The longer the upper shadow, the stronger the rejection of higher prices, increasing the likelihood of a bearish reversal in the following sessions. Traders often look for additional confirmation, such as a bearish candlestick following the Gravestone Doji, before making trading decisions.
When Does a Gravestone Doji Candlestick Happen?
The Gravestone Doji is most commonly observed at the top of an uptrend, where it serves as a warning sign that bullish momentum is fading. Its appearance suggests that buyers initially pushed prices higher, but their strength weakened as sellers stepped in, preventing further gains. This shift in control often signals a potential bearish reversal, as market participants take profit or initiate short positions in anticipation of a downtrend. The significance of this pattern increases when it forms near key resistance levels, trendlines, or after an extended price rally.
While the Gravestone Doji is primarily known as a bearish reversal pattern, it can also emerge at the bottom of a downtrend. In such cases, it reflects market indecision rather than an immediate shift in trend. If accompanied by high trading volume and followed by a strong bullish confirmation candle, it may suggest that selling pressure is weakening, and a potential trend reversal to the upside could occur. However, traders should exercise caution and use additional indicators, such as RSI or MACD, to confirm the market's next move.
How Often Does a Gravestone Doji Candlestick Occur?
The Gravestone Doji is considered an uncommon candlestick pattern, making it less frequent than more standard reversal formations like the engulfing or hammer patterns. Its rarity stems from the specific conditions required for its formation—where the market experiences a strong push higher, only to have sellers fully reclaim control by the session's close. Because such price action represents a decisive shift in momentum, the Gravestone Doji is more likely to appear during periods of market exhaustion or trend culmination, rather than in normal trading fluctuations.
Due to its infrequency, traders must be cautious when interpreting this pattern, as relying solely on it for trading decisions can lead to false signals. It is essential to analyze broader market conditions, including volume, trend strength, and supporting indicators, before acting on the signal. When a Gravestone Doji does appear, it becomes a highly valuable warning sign, especially when aligned with key resistance levels or overbought conditions in momentum indicators like RSI. However, confirmation from subsequent price action—such as a strong bearish candle following the Doji—is necessary to validate its bearish implications and reduce the risk of misinterpreting market noise.
How to Read a Gravestone Doji Candlestick in Technical Analysis?
Interpreting a Gravestone Doji in technical analysis requires a deep understanding of market psychology and price action. This candlestick pattern is not just a visual representation of price movement; it tells a story of a battle between buyers and sellers. The Gravestone Doji reflects a shift in control, where bullish momentum is rejected, and selling pressure dominates by the session’s close.
Key Elements of a Gravestone Doji Interpretation
1. Bullish Attempt
At the beginning of the session, buyers take control, driving the price higher as demand increases. This creates the long upper shadow, representing an effort by bulls to push prices upward. This attempt may be fueled by positive market sentiment, strong fundamentals, or short-term breakout traders jumping in. The higher the wick, the more aggressive the buying attempt during that period. However, the inability to sustain these gains raises a red flag about the strength of the uptrend.
2. Bearish Rejection
Despite the initial bullish surge, sellers step in aggressively, preventing the price from holding at higher levels. By the end of the session, selling pressure forces the price back to its opening level or very close to it. This suggests that the earlier optimism has faded, and traders are either taking profits or initiating short positions, anticipating further downside. The strong rejection of higher prices is a signal that buyers may have exhausted their strength, making a potential trend reversal more likely.
Additional Factors to Consider
While the Gravestone Doji suggests a bearish shift, traders should not act on it alone. Its effectiveness increases when supported by additional factors:
- Volume Confirmation: A high-volume Gravestone Doji suggests strong participation in the rejection of higher prices, increasing the likelihood of a bearish reversal.
- Position in the Trend: Appearing at the peak of an uptrend gives the Gravestone Doji more weight as a reversal signal. If it forms in a sideways market, it may simply indicate temporary resistance rather than a full trend reversal.
- Next Candlestick Confirmation: A strong bearish candle following the Gravestone Doji validates the shift in momentum and confirms selling pressure dominance.
More information can be found in this video.
How Accurate is the Gravestone Doji Candlestick in Technical Analysis?
The accuracy of the gravestone doji as a bearish reversal indicator is contingent upon various factors, including market conditions, timeframes, and the presence of confirming signals. While the pattern can suggest a potential reversal, it is not infallible and may produce false signals, especially in volatile or sideways markets. Therefore, traders should not rely solely on the gravestone doji but should use it in conjunction with other technical analysis tools to enhance accuracy.
How Reliable is a Gravestone Doji Candlestick in Technical Analysis?
The Gravestone Doji is considered a strong bearish signal, but its reliability depends on context and confirmation. When it appears after a prolonged uptrend, it often suggests buyer exhaustion, making a trend reversal more likely. However, market conditions play a crucial role—some assets may react more predictably to the pattern than others, and the timeframe being analyzed can impact its effectiveness. In higher timeframes (such as daily or weekly charts), the Gravestone Doji tends to be more reliable, as it reflects a broader shift in sentiment. In contrast, lower timeframes (such as 5-minute or 15-minute charts) are more prone to market noise, making the pattern less meaningful unless supported by strong volume and additional indicators.
To increase the reliability of the Gravestone Doji, traders should incorporate technical confirmation tools. For example, a bearish follow-through candle after the pattern strengthens the likelihood of a downtrend. Volume analysis is another key factor—if the Gravestone Doji forms on high trading volume, it signals stronger conviction from sellers. Additionally, traders can use momentum indicators like the Relative Strength Index (RSI) or the Moving Average Convergence Divergence (MACD) to confirm overbought conditions and further validate the reversal signal. While the Gravestone Doji is a valuable pattern, relying solely on it without supporting evidence increases the risk of false signals.
When is the Best Time to Trade Using a Gravestone Doji Candlestick?
The optimal time to trade a gravestone doji is when it appears after a strong uptrend, suggesting that the bullish momentum is fading and a potential bearish reversal is approaching. This pattern indicates that buyers initially drove prices higher but failed to maintain control, allowing sellers to push the price back down to the opening level. However, entering a trade solely based on the gravestone doji can be risky, as market conditions can sometimes cause temporary pullbacks rather than full trend reversals. To minimize false signals, traders should wait for additional confirmation, such as a bearish candlestick closing below the gravestone doji's low or a break of key support levels. The pattern becomes even more significant when it forms near historically strong resistance zones, where price rejections have occurred in the past.
Aside from price action confirmation, traders should consider other technical indicators to strengthen their analysis. For example, if the gravestone doji forms while the relative strength index (RSI) indicates overbought conditions, it reinforces the likelihood of a trend reversal. Additionally, the moving average convergence divergence (MACD) can provide further validation if it shows a bearish crossover following the doji’s formation. Trading volume is another crucial factor; a gravestone doji with high volume suggests strong participation from market participants, making the reversal more credible. In contrast, a low-volume doji may indicate weak conviction, reducing the pattern’s reliability. By combining these technical elements, traders can improve their timing, enhance trade accuracy, and increase the probability of executing successful bearish trades.
Trading the Gravestone Doji
Trading the gravestone doji requires careful analysis, confirmation, and risk management. Since this candlestick pattern often signals a potential bearish reversal, traders must ensure that the market conditions align with this implication before executing a trade. The gravestone doji alone does not provide enough confirmation for a trade, so additional price action signals or technical indicators should be used to validate the setup.
Example 1: Trading the Gravestone Doji in Forex
A trader analyzing the EUR/USD currency pair on a daily chart notices that the pair has been in an uptrend for two weeks, gaining nearly 300 pips. As the price approaches a resistance level at 1.1200, where it has previously struggled to break higher, a gravestone doji forms. This pattern suggests that buyers attempted to push the price higher but were met with strong selling pressure, causing the price to close near the opening level.
Trading Strategy for This Example
- Confirmation: The next day, a large bearish candlestick forms, closing below the low of the gravestone doji.
- Entry Point: The trader enters a short position at 1.1180, just below the doji’s low.
- Stop-Loss Placement: A stop-loss is placed above the gravestone doji’s high at 1.1250 to limit potential losses.
- Profit Target: The trader sets a take-profit level at 1.1050, aligning with a previous support zone.
- Risk Management: Since the stop-loss is 70 pips away, the trader ensures proper position sizing to maintain a 2:1 risk-reward ratio.
Over the next few days, the EUR/USD pair declines, confirming the reversal. The trade reaches the take-profit target, yielding a successful outcome.
Example 2: Trading the Gravestone Doji in Stocks
A trader monitoring Tesla (TSLA) stock on an hourly chart observes a steady uptrend. As the stock reaches a key resistance level at 900 dollars, a gravestone doji appears on a high-volume session. This formation indicates that buyers attempted to drive the price higher but were overpowered by sellers, suggesting a potential shift in momentum.
How to Trade This Setup
- Confirming the Pattern: The following hour, TSLA forms a red bearish candle, confirming that sellers are gaining control.
- Short Entry: The trader opens a short position at 895 dollars, slightly below the doji’s low.
- Stop-Loss: A stop-loss is set above the doji’s high at 915 dollars to protect against a false breakout.
- Exit Strategy: The profit target is placed at 865 dollars, aligning with a previous support level.
Within a few hours, Tesla’s price declines, reaching the profit target and resulting in a successful short trade.
Gravestone Doji vs. Dragonfly Doji
While the gravestone doji is a bearish reversal pattern characterized by a long upper shadow and no lower shadow, the dragonfly doji is its bullish counterpart. The dragonfly doji has a long lower shadow with no upper shadow, indicating that sellers drove the price down during the session, but buyers managed to bring it back up to the opening level. This pattern suggests a potential bullish reversal, especially when it appears after a downtrend.
Limitations of a Gravestone Doji
Despite its significance, the gravestone doji has limitations:
- False Signals: The pattern can occur without leading to a trend reversal, especially in choppy or sideways markets.
- Reliance on Confirmation: Without confirmation from subsequent price action or other indicators, the gravestone doji's predictive power diminishes.
- Market Context: The pattern's effectiveness varies across different markets and timeframes, necessitating a comprehensive analysis before making trading decisions.
Therefore, it's crucial to use the gravestone doji in conjunction with other technical analysis tools and not as a standalone signal.

How Do You Trade a Gravestone Doji?
Trading the gravestone doji involves recognizing the pattern and confirming its implications before making trading decisions. Here's a step-by-step guide:
- Identify the Pattern: Look for a candlestick with a long upper shadow and little to no lower shadow, where the open, close, and low prices are nearly identical.
- Confirm the Signal: Wait for the next candlestick to close below the gravestone doji's close. This bearish confirmation suggests that sellers have taken control.
- Enter the Trade: Consider entering a short position after confirmation.
- Set Stop-Loss: Place a stop-loss order above the high of the gravestone doji to manage risk.
- Monitor and Exit: Use additional technical indicators or support levels to determine exit points.
It's essential to combine the gravestone doji with other technical tools to enhance its effectiveness.
How to Use the Gravestone Doji in a Trading Strategy?
Incorporating the gravestone doji into a trading strategy involves:
- Trend Analysis: Ensure the pattern appears after an uptrend, indicating a potential reversal.
- Volume Confirmation: Higher trading volume during the gravestone doji formation can strengthen the reversal signal.
- Complementary Indicators: Use indicators like the Relative Strength Index (RSI) or Moving Average Convergence Divergence (MACD) to confirm overbought conditions.
- Risk Management: Implement stop-loss orders and position sizing to manage potential losses.
By integrating these elements, traders can develop a more robust strategy around the gravestone doji.
What Does a Gravestone Doji Indicate?
The gravestone doji indicates a shift in market sentiment, where buyers initially push prices higher, but sellers eventually take control, erasing the gains by the session's close. The long upper shadow represents the failed bullish attempt, while the absence of a lower shadow signals that selling pressure dominated by the end of the session. This price action suggests that the market is rejecting higher levels, increasing the likelihood of a potential bearish reversal.
This pattern is particularly significant when it forms after a prolonged uptrend, as it may indicate that buyers are losing momentum and that sellers are preparing to drive prices lower. However, traders should wait for confirmation, such as a bearish candlestick following the gravestone doji, before making trading decisions. When combined with other technical indicators like the relative strength index showing overbought conditions or high trading volume, the gravestone doji becomes a stronger signal that a downward move could follow.
The Different Types of Doji Patterns
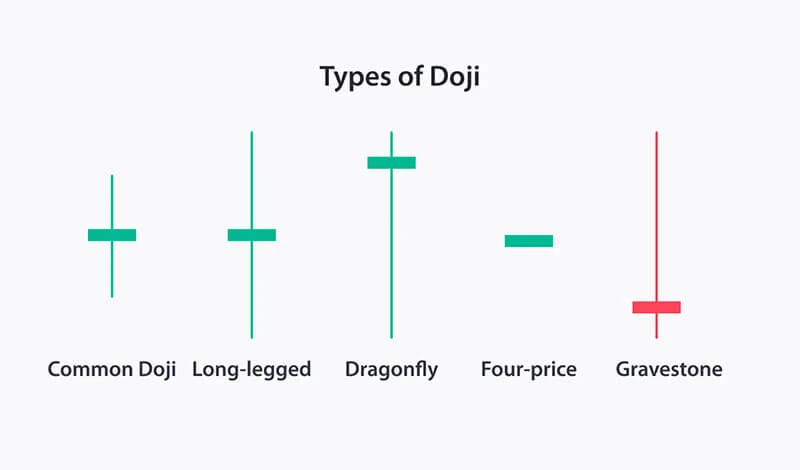
Doji candlesticks are unique formations in technical analysis that reflect market indecision and often signal potential reversals or trend continuations. They occur when the opening and closing prices are nearly identical, resulting in a small or nonexistent real body. However, the shape and position of the shadows vary, giving rise to different types of doji patterns, each with distinct implications for traders.
Standard Doji
The standard doji appears when the open and close prices are almost the same, with upper and lower shadows of similar length. This formation indicates that neither buyers nor sellers had a clear advantage during the session, leading to a neutral outcome. The standard doji is often seen in consolidation phases and suggests that the market is in a state of indecision. When it appears after a strong trend, it may signal an impending reversal, but confirmation from the next candlestick is crucial before making trading decisions.
Gravestone Doji
The gravestone doji forms when the open, close, and low prices are nearly identical, with a long upper shadow and no lower shadow. This pattern suggests that buyers attempted to push prices higher, but selling pressure eventually took over, driving the price back to its original level. It often signals a potential bearish reversal, especially when it forms after an extended uptrend. Traders look for additional confirmation, such as a bearish candlestick following the gravestone doji, before entering short positions.
Dragonfly Doji
The dragonfly doji is the opposite of the gravestone doji, featuring a long lower shadow and little to no upper shadow. This pattern suggests that sellers initially drove prices lower, but buyers regained control and pushed the price back up to the opening level. The dragonfly doji is commonly found at the end of a downtrend, where it may indicate a bullish reversal. However, traders should seek confirmation from a strong bullish candlestick or other indicators before acting on this signal.
Long-Legged Doji
The long-legged doji is characterized by extended upper and lower shadows, showing that the market experienced high volatility during the session. The presence of long wicks suggests that prices fluctuated significantly, but neither buyers nor sellers were able to maintain control. This doji often appears during periods of market uncertainty and can precede a trend reversal or continued consolidation. Its significance depends on where it forms within the trend and whether it is followed by a strong directional move.
Each type of doji provides valuable insights into market sentiment. While they are often associated with reversals, their meaning depends on the context in which they appear. Traders should always confirm their signals using additional technical analysis tools, such as trendlines, support and resistance levels, and momentum indicators, before making trading decisions.
Gravestone Doji in an Uptrend
When a gravestone doji appears during an uptrend, it signals that the upward momentum may be weakening. Buyers were unable to sustain higher prices, and sellers pushed the price back to the opening level, indicating a potential bearish reversal. Traders should seek confirmation from subsequent bearish candlesticks before considering a short position.
Gravestone Doji in a Downtrend
While less common, a gravestone doji can occur in a downtrend. In this context, it may indicate a continuation of the bearish trend, as sellers maintain control after an attempt by buyers to push prices higher. However, it's crucial to confirm this signal with additional analysis, as it could also signify indecision.
Does It Matter if a Gravestone Doji Candlestick is Red or Green?
In a gravestone doji, the open and close prices are nearly identical, resulting in a minimal real body. Therefore, the color of the candlestick (red or green) is insignificant, as the pattern's interpretation relies on the long upper shadow and the position of the open and close prices.
What Are the Benefits of a Gravestone Doji Candlestick?
The gravestone doji offers several advantages:
- Early Reversal Signal: It can provide an early indication of a potential bearish reversal.
- Clear Visual Pattern: Its distinct shape makes it easy to identify on candlestick charts.
- Risk Management: The pattern's structure allows traders to set precise stop-loss levels above the upper shadow.
However, it's essential to use this pattern in conjunction with other analysis tools for better accuracy.
What Candlestick Pattern is Similar to a Gravestone Doji?
The shooting star is one of the candlestick patterns most closely resembling the gravestone doji. Both patterns share a similar structure, featuring a long upper shadow and a small real body positioned near the session's low. This formation suggests that buyers attempted to push the price higher, but sellers regained control and drove it back down, indicating potential weakness in the uptrend.
Despite these similarities, there are key differences between the two patterns. The shooting star has a small real body, meaning there is a slight difference between the opening and closing prices. In contrast, the gravestone doji’s open and close prices are nearly identical, creating an almost nonexistent real body. This subtle variation can influence how traders interpret the pattern, as the gravestone doji represents stronger market indecision before the bearish shift, whereas the shooting star still reflects some degree of buying and selling imbalance.
Both the gravestone doji and the shooting star are typically seen at the end of an uptrend and are used to signal a potential bearish reversal. However, their effectiveness depends on market conditions, volume, and confirmation from subsequent candlesticks. Traders often look for a strong bearish candle following either pattern to validate the reversal signal. Additionally, combining these patterns with technical indicators such as the relative strength index (RSI) or moving averages can help increase their reliability in predicting market trends.
The Gravestone Doji Pattern – Pros and Cons
Pros:
- Early Warning: Provides an early signal of a potential trend reversal.
- Simplicity: Easy to identify due to its unique shape.
- Risk Management: Facilitates setting clear stop-loss levels.
Cons:
False Signals: May provide misleading signals in certain market conditions.
- Requires Confirmation: Must be used alongside other indicators for reliability.
- Market Context Dependence: Its effectiveness varies across assets and timeframes.
Using a Doji to Predict a Price Reversal
A doji candlestick, including the gravestone doji, is commonly used to predict price reversals. The key considerations for traders include:
- Context of the Trend:
- A gravestone doji appearing after an uptrend often signals a bearish reversal.
- A dragonfly doji in a downtrend may indicate a bullish reversal.
- Volume Confirmation:
- Higher volume during a doji formation strengthens its significance.
- Next Candlestick Confirmation:
- A strong bearish candle after a gravestone doji confirms a potential downtrend.
- A bullish candle following a dragonfly doji supports a bullish continuation.
- Indicator Support:
- RSI, MACD, and moving averages can validate the trend shift.
FAQ
1. Is a Gravestone Doji Always a Bearish Reversal Signal?
Not always. While it often signals a bearish reversal, context matters. If it appears in a downtrend, it may indicate continued bearish pressure rather than a reversal.
2. How Can I Confirm a Gravestone Doji Trade?
Use confirmation indicators such as:
- A strong bearish candlestick after the doji.
- RSI indicating overbought conditions.
- Volume increasing during the doji formation.
3. Can a Gravestone Doji Occur in Any Timeframe?
Yes, but its significance is greater in higher timeframes (daily, weekly charts) than in lower timeframes (5-minute, 15-minute charts), which can be more volatile.
4. How Do I Differentiate Between a Gravestone Doji and a Shooting Star?
- Gravestone Doji: Open and close prices are nearly the same.
- Shooting Star: Has a small real body, with a long upper wick.
5. Can a Gravestone Doji be Used Alone?
No. It should be combined with other technical indicators and market context for more accurate predictions.
ආපසු යන්න ආපසු යන්න
