In the fast-moving world of trading, recognizing subtle signals can make all the difference between success and missed opportunities. One such powerful yet often overlooked signal is the spinning top candlestick. This fascinating pattern tells a compelling story of market indecision, where neither buyers nor sellers can take full control, leaving prices hovering near their opening levels. Whether you’re trading stocks, forex, or cryptocurrencies, understanding the spinning top candlestick can give you a critical edge, helping you anticipate potential reversals or pauses in the market’s momentum. If you’re eager to sharpen your technical analysis skills and uncover hidden insights on your charts, diving deep into the spinning top candlestick pattern is a smart and rewarding place to start.
Table of Contents
What is Spinning Top Candlestick?
Bullish Spinning Top Candlestick
Bearish Spinning Top Candlestick
Understanding Spinning Top Candlesticks
Formation of the Spinning Top Candlestick
Trading with the Spinning Top of a Candlestick Pattern
Utilizing the Spinning Top Candlestick Pattern
Insights from the Spinning Top Candlestick
Advantages and Disadvantages of Spinning Top Candlestick Pattern
What Does a Spinning Top Candlestick Tell You?
Double Spinning Top Candlesticks
Key Takeaways
- Indicates Market Indecision: The spinning top pattern reflects a balance between buyers and sellers, signaling potential trend reversals.
- Neutral Pattern: It is neither inherently bullish nor bearish; context within the trend is crucial.
- Confirmation is Essential: Traders should seek confirmation from subsequent candlesticks or technical indicators before making decisions.
- Versatile Application: Applicable across various markets, including forex, stocks, and commodities.
🔗 What
What is a Spinning Top Candlestick?
A spinning top candlestick is a unique and highly informative chart pattern that traders and analysts closely watch when evaluating market conditions. It is characterized by a small real body positioned near the center of the candle, with long upper and lower shadows (or wicks) extending above and below the body. The small body shows that the difference between the opening and closing prices during the trading session was minimal, meaning the market ended the day with little net change. Meanwhile, the long shadows reflect significant price movements in both directions throughout the session — buyers pushed prices higher, and sellers pushed prices lower, but ultimately neither side could maintain control.
This formation typically signals market indecision and uncertainty. Neither the bulls nor the bears were strong enough to dominate the session, and as a result, the price closed near where it opened. While a single spinning top does not always signal a reversal, its appearance can be a warning sign that the current trend is losing momentum and that a potential change in direction may be on the horizon. Traders often look for confirmation from the next few candles or additional technical indicators to decide whether the spinning top marks a temporary pause or the start of a new trend.
Characteristics:
Feature | Description |
Real Body | Small, indicating minimal price movement |
Upper Shadow | Long, showing high intraday price |
Lower Shadow | Long, showing low intraday price |
Color | Can be bullish (white/green) or bearish (black/red) |
This pattern suggests market indecision and is often found at the end of uptrends or downtrends, potentially signaling a reversal.
🔗 Bullish
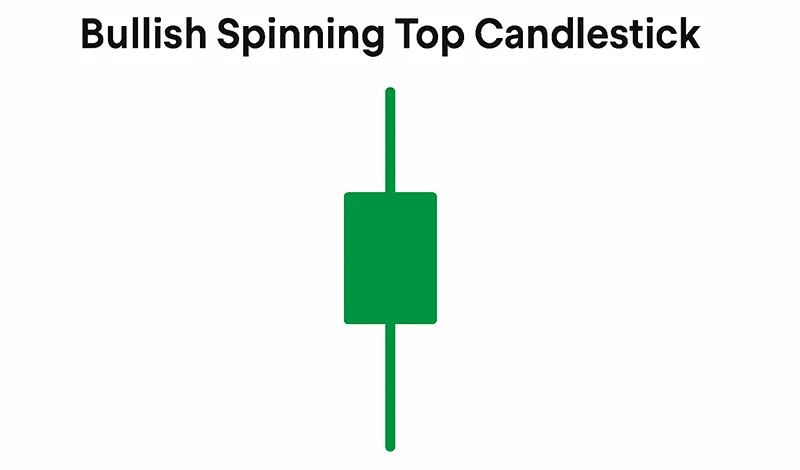
Bullish Spinning Top Candlestick
A bullish spinning top candlestick is a meaningful signal in technical analysis, especially when it appears after a sustained downtrend. This pattern forms when the closing price is slightly above the opening price, creating a small real body that is positioned between long upper and lower shadows. While the small body suggests that the session ended with only a modest gain, the long shadows reveal that both buyers and sellers were active during the trading period, pushing prices significantly higher and lower. However, by the close, buyers had gained a slight advantage, pushing the price just above the open.
This subtle sign of bullish pressure can indicate that the selling momentum, which has been driving the downtrend, is starting to weaken. Buyers are entering the market and challenging the dominance of sellers. While the bullish spinning top alone does not guarantee a trend reversal, it serves as an important early warning that sentiment may be shifting. Traders typically wait for confirmation from the next candlestick — ideally, a strong bullish candle — before considering it a reliable signal to enter a long position or adjust their strategy.
Key Points:
• Appears after a downtrend, signaling potential weakening of bearish momentum
• Small real body with long upper and lower shadows, reflecting market indecision
• Requires confirmation from subsequent bullish candlestick before acting
Example Scenario:
Imagine a stock or currency pair that has been declining steadily over several days. On one session, a bullish spinning top forms, showing that although sellers tried to continue pushing prices lower, buyers stepped in with enough strength to lift the close slightly above the open. This introduces uncertainty into the market, hinting that the downtrend may be losing steam. On the following session, a strong bullish candlestick appears — perhaps a long-bodied green candle — confirming the shift in sentiment and providing a clearer signal that a reversal to an uptrend may be underway. Traders seeing this sequence may choose to enter a long position, place protective stop-loss orders, or adjust their positions to capture the potential upward move.
🔗 Bearish
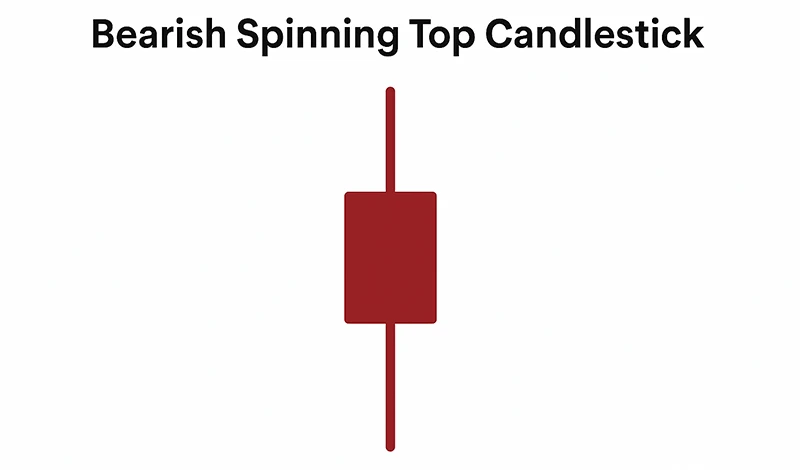
Bearish Spinning Top Candlestick
A bearish spinning top candlestick is an important signal that traders watch carefully, particularly when it appears after a strong uptrend. This pattern forms when the closing price is slightly below the opening price, resulting in a small real body situated between long upper and lower shadows. Although the price fluctuated significantly in both directions during the session, the market ultimately closed just below where it opened — signaling that neither buyers nor sellers were fully in control, but that sellers managed to gain a slight edge by the close.
The appearance of a bearish spinning top after an extended uptrend can serve as an early warning sign that bullish momentum is beginning to fade. Sellers are starting to push back, testing the strength of buyers who have been driving the price higher. While the pattern itself does not confirm a trend reversal, it suggests that market sentiment is shifting, and that the uptrend could be running out of steam. As with its bullish counterpart, traders typically wait for confirmation — usually in the form of a strong bearish candlestick in the following session — before making any trading decisions or taking new positions.
Key Points:
• Appears after an uptrend, signaling potential exhaustion of bullish momentum
• Small real body with long upper and lower shadows, reflecting market indecision
• Requires confirmation from subsequent bearish candlestick before acting
Example Scenario:
Consider a stock or currency pair that has been trending upward for several days or weeks. During one session, a bearish spinning top forms, showing that while buyers continued to push the price higher and sellers pushed it lower, the session ultimately ended with a slight loss. This subtle shift can signal that the uptrend is weakening and that sellers are gaining confidence. On the next session, a strong bearish candlestick — such as a long-bodied red candle — appears, confirming that the tide has turned in favor of the bears. Traders observing this sequence might use it as a signal to enter short positions, tighten their stop-loss levels on long trades, or prepare for a potential trend reversal to the downside.
🔗 Understanding
Understanding Spinning Top Candlesticks
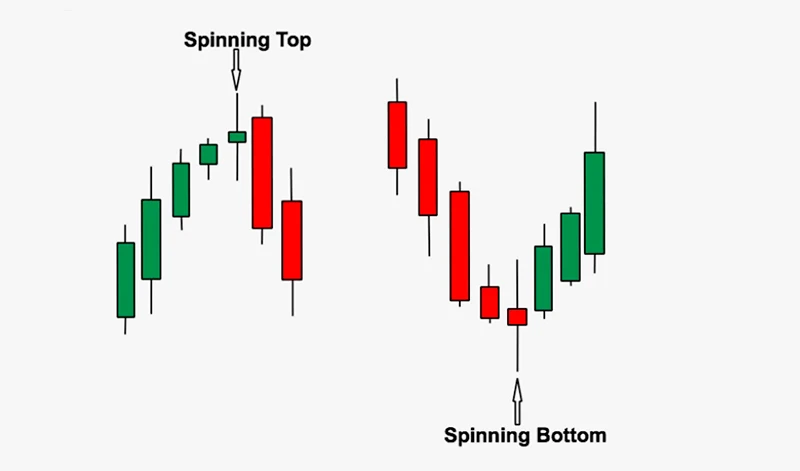
The spinning top candlestick pattern is a powerful visual representation of market psychology and the constant battle between buyers and sellers. At its core, this pattern reflects a tug-of-war where neither side is able to claim a decisive victory. During the trading session, prices swing significantly in both directions — buyers push prices up, and sellers push prices down — but by the end of the session, the market closes very close to where it opened. This results in a small real body with long upper and lower shadows, capturing the indecision and balance between opposing market forces.
What makes the spinning top especially valuable in technical analysis is its ability to signal a potential shift in market sentiment. While the pattern can appear in any market condition, its significance is much greater when it shows up after a sustained trend — whether bullish or bearish. In the context of an uptrend, a spinning top suggests that the buyers who have been in control are starting to face resistance from sellers, hinting at possible exhaustion in the upward momentum. In a downtrend, it signals that the sellers who have been dominating are beginning to encounter buying pressure, suggesting that the downward momentum may be weakening.
It’s important to understand that the spinning top, on its own, is not a definitive buy or sell signal. Instead, it serves as an early warning flag — a sign that the current trend may be running out of steam and that a reversal or pause could be approaching. Traders typically wait for confirmation through the next few candlesticks or from other technical indicators before making decisions. By carefully interpreting spinning top patterns within the context of the broader trend, traders can gain valuable insights into market sentiment, potential turning points, and more precise entry and exit opportunities.
Interpretation Based on Trend Context:
Trend Context | Implication |
Uptrend | Potential bearish reversal |
Downtrend | Potential bullish reversal |
Sideways | Continued indecision, wait for breakout |
🔗 Formation
Formation of the Spinning Top Candlestick
The formation of the spinning top candlestick is closely tied to the dynamics of market sentiment and intraday price movements. What makes this pattern stand out is not just the small real body but the story it tells about the balance of power between buyers and sellers during a trading session. The key characteristic of this pattern is that, although prices move significantly up and down throughout the session, the market ultimately closes near where it opened — a clear sign that neither side was able to assert dominance.
Formation Steps:
- Market opens at a certain price: The trading session begins with an opening price that sets the initial tone for the market.
- Prices move significantly higher and lower during the session: As trading progresses, both buyers and sellers become active. Buyers push prices higher, testing resistance levels, while sellers push prices lower, testing support levels. This tug-of-war results in long upper and lower shadows on the candlestick.
- Market closes near the opening price: Despite the intraday volatility, the market ultimately settles near the opening price, forming a small real body. This signals that neither bulls nor bears managed to gain control, ending the session in a kind of draw.
This pattern visually represents market indecision and uncertainty. The long wicks show that there was plenty of activity and effort on both sides, but the lack of follow-through means neither side was able to impose a lasting impact on the session’s outcome. When traders spot a spinning top on a chart, they should recognize it as a potential pause in the prevailing trend — a moment when the market is taking a breath, possibly before reversing direction or continuing its prior trend.
However, traders must always remember that context matters. A spinning top in isolation does not provide a clear trading signal; it needs to be interpreted within the broader market environment and preferably confirmed by subsequent price action or other technical indicators before decisions are made.
🔗 Trading
Trading with the Spinning Top Candlestick Pattern
When trading the spinning top pattern, it's crucial to consider the broader market context and seek confirmation before acting.
Trading Setup:
- Wait for Confirmation: Look for the next candlestick to confirm the reversal.
- Use Technical Indicators: Combine with RSI, MACD, or volume analysis.
- Set Stop-Loss Orders: Protect against false signals by setting appropriate stop-loss levels.
Example:
If a spinning top forms after an uptrend and is followed by a bearish candlestick, it may signal a good opportunity to enter a short position, with a stop-loss above the high of the spinning top.
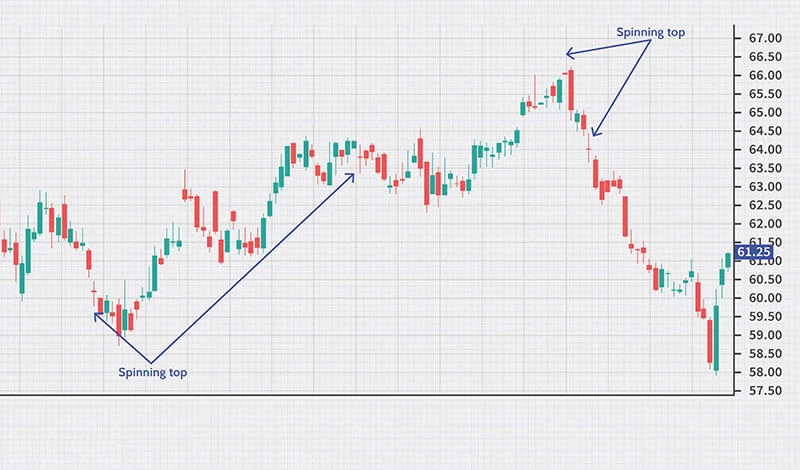
The spinning top candlestick pattern is a versatile tool in a trader’s arsenal, but its real power comes when it’s combined with well-defined strategies and broader market analysis. While the spinning top itself signals market indecision, it becomes most useful when used in context and alongside other indicators. Here are three popular trading strategies that incorporate the spinning top candlestick pattern to help traders improve their decision-making:
Reversal Strategy with Confirmation Candles
One of the most common ways traders use the spinning top pattern is as part of a reversal strategy, particularly when it appears after a strong trend. The idea here is to spot signs of trend exhaustion and prepare for a potential reversal.
How it works:
- Identify a sustained uptrend or downtrend on the chart.
- Watch for a spinning top to form near a key support (in a downtrend) or resistance (in an uptrend) level.
- Wait for the next candlestick (confirmation candle) to reveal the market’s direction:
- A bullish candle following a spinning top after a downtrend signals a potential upward reversal.
- A bearish candle following a spinning top after an uptrend signals a potential downward reversal.
- Enter the trade in the direction of the confirmation candle and set a stop-loss just beyond the high or low of the spinning top to manage risk.
Example:
After a long rally, you spot a spinning top near a major resistance level. The next candle is a strong red bearish candle. This confirms the signal, and you enter a short position, anticipating a pullback or trend reversal.
Support and Resistance Breakout Strategy
Another effective way to use spinning tops is around key support and resistance zones, where they often signal that the market is struggling to break through a level.
How it works:
- Identify major horizontal support or resistance levels on the chart.
- Watch for the formation of a spinning top candlestick as price tests these levels.
- Monitor the breakout direction:
- If price breaks above resistance after a spinning top, it signals that buyers have won the battle, and you can enter a long position.
- If price breaks below support after a spinning top, it signals that sellers have taken control, and you can enter a short position.
- Confirm the breakout with an increase in volume or a strong closing candle beyond the level.
Example:
Price approaches a key support level and forms a spinning top, suggesting indecision. Shortly after, price breaks below the support with a surge in volume, confirming bearish strength. You enter a short trade, aiming to ride the breakout momentum.
Range Trading with Spinning Tops
In sideways or ranging markets, spinning tops can be useful for range trading strategies, where traders look to profit from price bouncing between support and resistance.
How it works:
- Identify a well-defined range with clear support and resistance levels.
- Look for spinning tops to form near the top (resistance) or bottom (support) of the range.
- Use the spinning top as a signal that the price is likely to reverse back into the range.
- Enter a trade in the opposite direction of the boundary:
- Short at resistance if a spinning top forms.
- Go long at support if a spinning top appears.
- Place a stop-loss just outside the range boundary and target the opposite side of the range.
Example:
A currency pair has been trading between 1.1000 and 1.1200. Near 1.1200, you see a spinning top form, suggesting the rally is losing momentum. You enter a short trade, targeting 1.1000, with a stop-loss just above 1.1200.
Bonus Tip: Combine with Indicators
While the spinning top can be powerful on its own, its reliability increases when combined with technical indicators such as Relative Strength Index (RSI), Moving Average Convergence Divergence (MACD), or Bollinger Bands. For example, if a spinning top forms at resistance and the RSI shows overbought conditions, the chances of a reversal increase significantly.
By combining spinning tops with broader trading strategies, support/resistance analysis, and confirmation tools, traders can sharpen their timing, manage risk more effectively, and increase their odds of success in a wide range of market conditions.
🔗 Utilizing
Utilizing the Spinning Top Candlestick Pattern
The spinning top candlestick pattern offers traders a valuable tool to improve their market analysis and trading decisions when used thoughtfully. Its ability to reflect shifts in market sentiment makes it particularly useful for anticipating changes and fine-tuning trade setups.
One of the primary ways traders use the spinning top is by identifying potential reversals. When the pattern appears after a prolonged uptrend or downtrend, it often signals that the momentum driving the trend may be weakening. By recognizing this early warning sign, traders can prepare for possible changes in direction and adjust their positions accordingly, either by reducing exposure, tightening stops, or planning new trades in the opposite direction.
Another key application is in improving entry and exit points. On its own, the spinning top highlights indecision, but when combined with other technical tools — such as moving averages, support and resistance levels, RSI, or MACD — it can help traders time their entries and exits with greater precision. For example, spotting a spinning top near a resistance zone alongside an overbought RSI reading can strengthen the case for a potential short position. Similarly, at a support level, a spinning top paired with oversold conditions may signal a good opportunity to buy.
The pattern is also highly useful in risk management. Traders often use the high and low of the spinning top candle as reference points for placing stop-loss and take-profit orders. This approach allows for tighter risk control by defining clear boundaries for acceptable loss or desired profit. For instance, when trading a potential reversal, a stop-loss can be set just above the high of a bearish spinning top or just below the low of a bullish spinning top, helping to limit downside risk.
In practice, the spinning top should always be integrated into a larger, well-rounded trading strategy. This means taking into account the overall market context, aligning it with other technical signals, and considering relevant fundamental factors such as economic news or company reports. By treating the spinning top as one piece of the puzzle rather than a standalone signal, traders can make more informed decisions, reduce false signals, and increase their chances of success across various market conditions.
🔗 Insights
Insights from the Spinning Top Candlestick
The spinning top candlestick pattern offers traders a deeper look into the underlying sentiment of the market during a given period. One of its most important insights is the clear message of indecision. When a spinning top forms, it reveals that both buyers and sellers were active and influential during the session, but neither side managed to secure lasting control. This balance often results in price closing near its opening level, providing a visual cue that the market is temporarily uncertain about its next move.
Another key takeaway from the spinning top is its ability to hint at potential trend shifts. When this pattern appears after a prolonged move upward or downward, it suggests that the driving force behind the trend could be fading. Buyers may be losing confidence during an uptrend, or sellers may be losing strength during a downtrend. This shift can act as an early warning that a pause, pullback, or even a full reversal might be approaching.
Perhaps one of the most critical insights the spinning top provides is the need for caution and further validation before acting on its signal. While the pattern is useful for spotting changes in market behavior, it is not a definitive indicator on its own. Traders are reminded to seek additional confirmation, such as follow-up candlestick formations or signals from technical indicators, before making decisions. This careful approach helps reduce the likelihood of false signals and improves the overall reliability of trading strategies built around the spinning top. By understanding these insights, traders can better interpret price action and make more informed choices in their trading plans.
Advantages and Disadvantages of Spinning Top Candlestick Pattern🔗 Advantages
The spinning top candlestick pattern is widely used by traders across different financial markets due to its ability to highlight shifts in market sentiment. While it is a valuable tool for identifying moments of indecision and potential turning points, it is not without its limitations. Like any technical pattern, the spinning top is most effective when understood within the broader market context and combined with other forms of analysis. To use it successfully, it’s important to understand both its strengths and its weaknesses.
Advantages
Signals Market Indecision: One of the most important advantages of the spinning top pattern is its ability to reveal indecision in the market. It shows that neither buyers nor sellers were able to dominate the session, which can indicate that a current trend is weakening or coming to a pause. This insight is useful for traders looking to anticipate possible shifts in momentum.
Versatile Application: The spinning top pattern is not limited to one type of market or asset class. It can be used effectively in stocks, forex, commodities, indices, and even cryptocurrencies. This flexibility allows traders to apply the same principles across different markets without having to adjust their approach dramatically.
Risk Management Tool: The spinning top can be helpful in defining risk and setting appropriate entry and exit points. By identifying areas where momentum is stalling, traders can use the high and low of the spinning top candle to place stop-loss and take-profit orders. This can help minimize losses and lock in gains, improving overall risk management.
Disadvantages
Neutral Pattern: A major drawback of the spinning top is that it does not point to a clear direction on its own. It simply reflects indecision, meaning traders cannot rely on it as a standalone signal for entering or exiting a trade. Without additional context, its message can be vague.
Requires Confirmation: For the pattern to become actionable, traders need to wait for follow-up candlesticks or other technical signals to confirm whether a reversal or continuation is more likely. Acting too quickly on the appearance of a spinning top alone can lead to premature trades and unexpected outcomes.
Potential for False Signals: When used without considering market conditions or trend strength, the spinning top pattern can produce misleading signals. For example, in a strong trending market, a spinning top might simply reflect a temporary pause rather than an impending reversal. Without proper context and confirmation, relying solely on the pattern can result in incorrect assumptions and poor trading decisions.
Understanding these advantages and disadvantages can help traders use the spinning top candlestick pattern more effectively, improving their ability to interpret market sentiment and adjust their strategies accordingly.
What Does a Spinning Top Candlestick Tell You?🔗 Tell
A spinning top candlestick provides important clues about the underlying dynamics of a market session. It shows that throughout the trading period, both buyers and sellers were active, pushing prices in both directions, but ultimately neither side could secure a decisive outcome. The result is a small real body near the center of the candle, reflecting a closing price that is close to where the session began.
This pattern reveals hesitation among market participants. When seen on a chart, it suggests that the balance of power is temporarily neutral, and the market is taking a pause as traders reassess their positions. This is particularly meaningful after a long trend, as it may indicate that momentum is weakening and the enthusiasm driving the previous price movement is fading.
While often associated with potential reversals, the spinning top can also signal a potential consolidation period, where the market moves sideways before deciding on its next direction. In some cases, it may even foreshadow an upcoming breakout, especially if it appears near major support or resistance levels.
Additionally, the presence of a spinning top can reflect changing market sentiment due to external factors such as economic news, earnings reports, or geopolitical events. Traders interpreting the spinning top need to consider not just the shape of the candle but also its location on the chart, the strength of the previous trend, and the broader market environment to fully understand what the pattern is signaling.
🔗 Double
Double Spinning Top Candlesticks
A double spinning top candlestick pattern forms when two spinning tops appear consecutively on a price chart. This rare yet important formation magnifies the message of market indecision, as it shows that for two sessions in a row, neither buyers nor sellers were able to gain the upper hand. The presence of back-to-back spinning tops reflects an extended period of uncertainty, where both sides are testing the market but neither can push the price convincingly in their favor.
The repeated appearance of this pattern can carry even more weight than a single spinning top because it signals that the struggle between bulls and bears is persisting over time. This often suggests that the existing trend, whether upward or downward, is running out of momentum and that market participants are hesitating to commit to the current direction. As a result, the likelihood of a trend reversal or a significant breakout increases.
While the double spinning top can be a powerful indicator of change, it should never be used in isolation. Confirmation from subsequent price action or supporting technical indicators is essential before making trading decisions. For example, traders often look for a strong bullish or bearish candle following the pattern or use tools like RSI, MACD, or moving averages to assess whether the market is preparing to reverse or continue. Without this confirmation, the double spinning top may simply reflect a temporary consolidation phase rather than a decisive turning point.
Doji vs Spinning Top Candlestick Patterns
Feature | Doji | Spinning Top |
Real Body | Almost non-existent | Small |
Upper & Lower Shadows | Can be long or short | Typically long |
Market Indecision | High | Moderate |
Frequency | Less common | More common |
Interpretation | Stronger signal of indecision | Indicates indecision with potential for continuation or reversal |
While both patterns signify indecision, the doji's nearly equal open and close prices make it a stronger indicator of potential reversals compared to the spinning top.
Frequently Asked Questions (FAQ)🔗 FAQ
Q1: Can a spinning top appear in any market trend?
Yes, spinning tops can appear in uptrends, downtrends, or sideways markets. Their significance is heightened when they appear after a sustained trend, indicating potential exhaustion.
Q2: How should traders confirm the signal from a spinning top?
Traders should look for confirmation from subsequent candlesticks, such as a strong bullish or bearish candle, or use technical indicators like RSI or MACD to validate the potential reversal.
Q3: Is the color of the spinning top important?
While the color (bullish or bearish) can provide context, the primary focus should be on the pattern's position within the trend and the confirmation from subsequent market movements.
Q4: How does volume affect the interpretation of a spinning top?
High trading volume during the formation of a spinning top can add weight to the signal, suggesting that the indecision is significant and may lead to a notable market move.
Q5: Can spinning tops be used in conjunction with other patterns?
Absolutely. Combining spinning tops with other candlestick patterns or technical indicators can enhance the reliability of trading signals and provide a more comprehensive market analysis.
Note: This article is for educational purposes and does not constitute financial advice. Always conduct your own research before making trading decisions.
ফিরে যান ফিরে যান
