The Cup and Handle pattern is a widely recognized bullish continuation formation used by traders to anticipate potential upward price movements. Mastering this pattern can significantly enhance your trading strategy, providing clear entry points, effective risk management tactics, and defined profit targets. This comprehensive guide will cover everything from identifying and trading the pattern to managing risk and avoiding common pitfalls, helping you leverage this powerful technical analysis tool to maximize your trading performance.
Table of Contents
What Is a Cup and Handle Pattern?
How to Trade the Cup and Handle
Example Trading the Cup and Handle
Risk Management with Cup and Handle Pattern
Limitations of the Cup and Handle Pattern
Benefits of Trading on the Cup and Handle Pattern
What Does a Cup and Handle Pattern Indicate?
Types of Cup and Handle Patterns
Volume During the Cup Formation
What Is the Reversal Downtrend for Cup and Handle Pattern?
Key Takeaways
- Definition: The Cup and Handle pattern is a bullish continuation pattern resembling a tea cup, indicating potential upward price movements.
- Trading Strategy: Traders often enter positions upon breakout above the handle's resistance, setting stop-loss orders below the handle's low and targeting gains proportional to the cup's depth.
- Risk Management: Implementing appropriate risk management strategies, such as stop-loss orders, is crucial when trading this pattern.
- Limitations: The pattern may produce false signals; thus, it should be used in conjunction with other technical analysis tools.
- Benefits: When accurately identified, the pattern can offer favorable risk-reward opportunities in trending markets.
🔗 what
What Is a Cup and Handle Pattern?
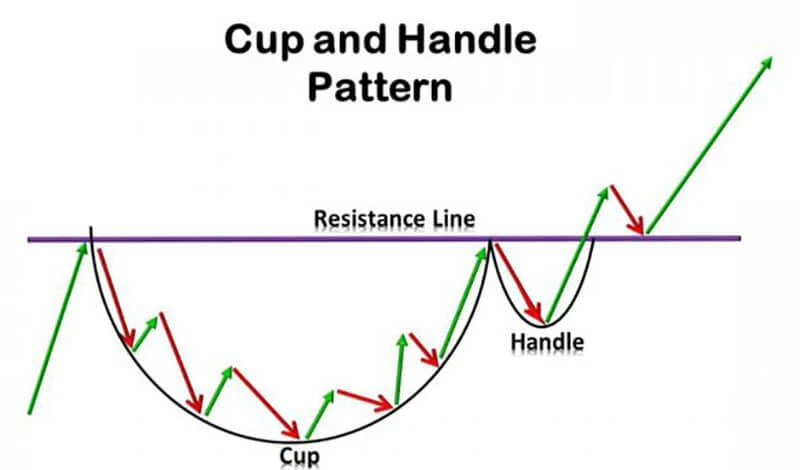
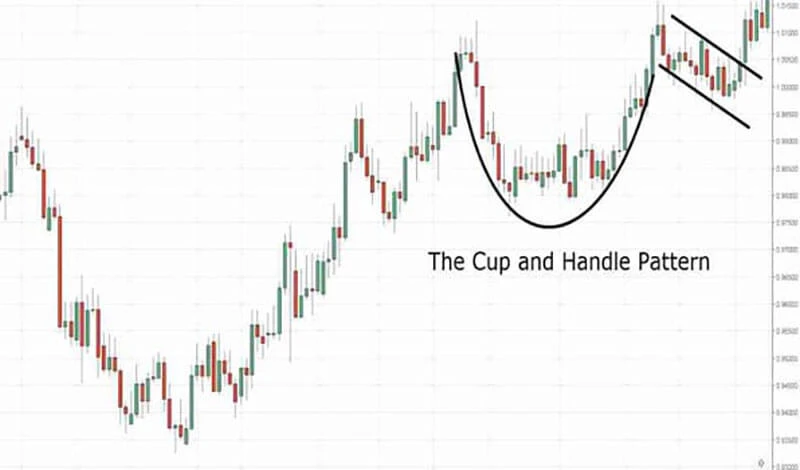
The Cup and Handle pattern is a widely recognized chart pattern in technical analysis, primarily indicating a potential continuation of a bullish trend. This formation visually resembles a tea cup, where the rounded portion represents the 'cup,' followed by a smaller consolidation phase known as the 'handle.' Traders and investors commonly interpret the pattern as a bullish indicator, suggesting that an asset’s price, after consolidating and briefly retracing, is likely to resume its upward trajectory once the pattern is confirmed.
Characteristics of the Cup:
• Shape: The cup portion of the pattern forms a clear, rounded 'U' shape, signifying a steady period of price consolidation. Unlike sharp, V-shaped recoveries, a proper cup shape typically shows a gentle bottoming process, reflecting a gradual shift from selling pressure to buying interest. This rounded shape represents the period when investor sentiment shifts from bearish or uncertain to bullish optimism.
• Depth: The cup's depth is another critical feature to examine closely. For an ideal Cup and Handle formation, the depth from the peak (the high point before the consolidation) down to the lowest point (trough) should typically range between 15% to 33%. A cup that is too shallow may suggest insufficient consolidation, whereas a cup too deep (beyond 50%) could indicate excessive volatility or weakness, diminishing the reliability of the pattern as a bullish continuation signal.
• Duration: Generally, the formation of a reliable cup occurs over an extended timeframe, typically spanning 1 to 6 months. Shorter durations may lack sufficient consolidation, reducing the validity of the pattern, while excessively long durations might dilute trader interest or introduce market dynamics unrelated to the original bullish trend.
Characteristics of the Handle:
The handle follows the completion of the cup formation, serving as a crucial indicator of readiness for a breakout. It represents a brief pause or retracement, providing a final consolidation phase before prices potentially advance higher.
• Formation: The handle is a short-term consolidation or mild pullback immediately following the completion of the cup's rounded bottom. This retracement generally slopes slightly downward or sideways, as short-term traders take profits or enter new short positions expecting resistance at the cup's rim. The resulting consolidation creates tension, setting the stage for a potential bullish breakout if the market resumes its upward trend.
• Depth: Ideally, the handle's retracement should be relatively shallow, typically ranging from 30% to 50% of the previous upward move from the cup's bottom to its rim. Handles that retrace excessively (beyond 50%) can signal weakening bullish momentum and may not offer as reliable a trading opportunity. Conversely, very shallow handles indicate robust buying interest and can often lead to more vigorous breakouts.
• Duration: The handle portion of the pattern typically forms relatively quickly compared to the cup, lasting between 1 to 4 weeks. The shorter duration reflects a temporary pause in the existing bullish trend rather than a prolonged bearish sentiment. Handles lasting significantly longer than four weeks may indicate indecision or a weakening of bullish conviction, thus diminishing the pattern's strength and reliability as a bullish indicator.
🔗 how
How to Trade the Cup and Handle
Trading the Cup and Handle pattern successfully requires careful identification of the formation, precise timing for trade entries, disciplined risk management, and clearly defined exit targets. Recognizing the pattern itself is only the first step; traders must carefully observe volume, resistance, and price movements to execute trades effectively and maximize their potential profitability. Understanding how to properly time entries, set realistic expectations, and strategically manage risks significantly improves the success rate of trades based on this pattern.
Entry Point
Selecting the correct entry point is critical when trading the Cup and Handle pattern, as it directly impacts profitability and risk exposure. Traders should watch carefully for price action around the resistance formed by the cup’s upper rim, which serves as a significant psychological barrier. Typically, traders wait for a clear breakout above this resistance, confirmed by rising volume, indicating increased buying interest and strong momentum. Ideally, this breakout candle should be accompanied by above-average trading volume, demonstrating widespread market confidence in the upward movement. Traders may enter the market immediately upon breakout confirmation or wait for a subsequent retest of the breakout level, which often provides additional confirmation and a safer entry opportunity.
Stop-Loss
Implementing a stop-loss strategy is an essential part of trading the Cup and Handle pattern, as it helps minimize losses if the breakout fails. A suitable placement of a stop-loss order is generally just beneath the lowest price reached during the handle formation. This specific level is selected because a breakdown below the handle’s low indicates that the bullish momentum anticipated by the pattern is weakening or invalid. Setting a stop-loss at this strategic level ensures sufficient room for minor fluctuations and temporary retracements, while effectively managing overall risk. It also provides traders with peace of mind, clearly defining a maximum acceptable loss before entering the trade.
Target
Determining an accurate profit target is equally important in achieving consistent trading success with the Cup and Handle pattern. Traders typically calculate the profit target by measuring the vertical distance from the lowest point of the cup’s base to the resistance level at the cup’s rim. This distance represents the pattern's depth and provides a practical projection of the expected price move once a confirmed breakout occurs. After the breakout, traders project this measured distance upward from the resistance line to set a realistic and achievable price target. This method provides traders with clear expectations, ensuring they exit the trade with appropriate gains rather than holding positions indefinitely and risking market reversals.
🔗 example
Example: Trading the Cup and Handle
Imagine a scenario where a particular stock experiences an initial strong upward move from $50 per share, rallying significantly to reach a peak of $100. After achieving this high, selling pressure increases, causing the stock price to gradually decline and consolidate, ultimately finding support around $75. This downward and subsequent upward movement forms the classic rounded bottom or "cup," characterized by a gradual shift from sellers dominating the market to renewed buying interest.
Following this formation, the stock price begins to stabilize, trading in a narrower range between approximately $75 and the previous resistance level at $100. During this consolidation phase, buyers and sellers reach equilibrium, with neither side able to dominate, creating a sideways movement as traders await further confirmation.
Subsequently, the stock price moves into the "handle" phase. During this period, the price slightly retraces, fluctuating within a narrow range between $90 and $100, signaling that selling pressure is diminishing. This consolidation is crucial as it represents traders locking in short-term profits or entering new positions cautiously, expecting either a decisive breakout or reversal.
The critical signal traders await in the Cup and Handle pattern emerges when the stock price successfully breaks above the resistance at $100. This breakout should ideally be accompanied by a significant increase in trading volume, demonstrating strong buying momentum and confirming bullish sentiment. Once the price surpasses $100, the pattern is considered confirmed, providing traders a solid entry signal.
At this point, a trader would place a buy order just above the resistance level of $100. To protect against potential false breakouts, they set a stop-loss order slightly below the lowest point of the handle, around $90. This ensures limited losses if the breakout fails and the price reverses sharply downward. You can trade all major stocks with NordFX.
Finally, to set a realistic profit target, the trader measures the vertical distance of the cup, which in this scenario is $25 (the difference from the cup's bottom at $75 to the breakout point at $100). They project this measurement upward from the breakout point, setting a profit target around $125. By establishing clear entry and exit points along with risk management measures, the trader ensures a structured approach to trading the Cup and Handle pattern.
Please note that this information is an example and does not contain financial advice.
🔗 risk
Risk Management with Cup and Handle Pattern
Proper risk management is essential for traders employing the Cup and Handle pattern to ensure long-term profitability and capital preservation. While setting appropriate stop-loss orders is fundamental, traders must integrate additional risk control measures to safeguard their investment capital and enhance overall profitability. One important element of risk management is carefully considering position sizing, which involves determining the appropriate quantity of shares or contracts to trade based on individual risk tolerance and account size. Smaller position sizes reduce exposure, allowing traders to sustain multiple small losses without significantly damaging their trading capital.
Another crucial strategy is diversification across multiple assets and market sectors. Rather than relying solely on trades generated from Cup and Handle patterns, traders should diversify their portfolio by incorporating various trading patterns, asset classes, and timeframes. Diversification helps cushion losses from unexpected market movements, ensuring that no single unsuccessful trade can have a disproportionately negative impact on overall performance.
Maintaining discipline through adherence to a predefined trading plan is equally important. Traders should establish clear entry and exit rules, profit-taking objectives, and loss thresholds before entering any trade. Sticking to these pre-determined rules helps traders avoid emotional decision-making, which often leads to overtrading, premature exits, or holding losing positions too long.
Moreover, traders should consistently monitor their trades and adjust stop-loss orders or take partial profits as the trade develops. Regularly reassessing market conditions ensures traders respond promptly to changing circumstances, protecting accumulated gains or minimizing losses effectively.
In addition, traders should consider external market conditions such as volatility, market sentiment, and economic indicators when evaluating the reliability of the Cup and Handle pattern. Avoiding trades during overly volatile periods or unfavorable market conditions can significantly improve trading outcomes.
By systematically combining stop-loss placement, appropriate position sizing, portfolio diversification, disciplined trading plans, and ongoing trade management, traders can effectively reduce the risks associated with trading Cup and Handle patterns and enhance their overall trading success.
🔗 limitations
Limitations of the Cup and Handle Pattern
Although the Cup and Handle pattern is highly regarded among traders as a bullish indicator, it does come with several notable limitations that traders should consider before relying heavily on it. One significant challenge involves its subjective nature, as the accurate identification of the pattern largely depends on individual interpretation of chart movements. Different traders may draw varying conclusions regarding the pattern’s boundaries or depth, potentially causing discrepancies and inconsistency in trading decisions.
Another limitation is the risk of false signals. Not all breakouts above the handle's resistance level will necessarily lead to sustained bullish moves. Occasionally, the breakout can fail, reversing direction shortly after entry. These false breakouts can result in unexpected losses if traders do not carefully implement risk management strategies, such as setting appropriate stop-loss orders or confirming breakouts through volume indicators or additional technical analysis methods.
Additionally, traders must consider that the Cup and Handle pattern requires significant time to develop fully, often spanning several weeks or even months. This prolonged formation period demands considerable patience and discipline from traders. Those who prefer rapid trading strategies or quick returns may find this waiting period impractical or frustrating, potentially leading to premature trade entries or exits and suboptimal trading decisions.
Furthermore, the identification of this pattern becomes highly subjective, as slight variations in price action can lead to misinterpretations or confusion among traders. Small differences in interpreting the depth, shape, or duration of the cup and handle formations can significantly impact trading accuracy, leading to inconsistent or unsuccessful outcomes.
Additionally, external market conditions play a substantial role in the success or failure of this pattern. During highly volatile market conditions, or when broader market sentiment is strongly bearish, even well-formed Cup and Handle patterns may fail to deliver the anticipated bullish continuation. Traders must therefore always consider the broader market context rather than relying solely on this chart pattern.
Finally, the Cup and Handle pattern might not be as effective when applied in isolation. Successful traders typically combine this formation with other technical indicators, such as moving averages, Relative Strength Index (RSI), or volume analysis, to enhance the accuracy and reduce false signals, underscoring the limitations inherent when relying solely on a single technical pattern.

🔗 benefits
Benefits of Trading on the Cup and Handle Pattern
Trading based on the Cup and Handle pattern provides several notable benefits, making it attractive to traders of varying experience levels. One primary advantage is the clarity it offers regarding entry and exit points. Due to its distinct structure, traders can easily identify precise breakout levels, enabling them to enter trades confidently once the price moves above the handle's resistance. Likewise, clearly identifiable stop-loss levels beneath the handle's lowest point ensure traders can manage risk effectively, establishing straightforward parameters for exiting unsuccessful trades.
Another significant advantage of the Cup and Handle pattern is the favorable risk-reward ratio it frequently presents. Since the price target is derived from the measurable depth of the cup projected upward from the breakout level, the potential profit often substantially exceeds the risk undertaken by setting the stop-loss below the handle. This characteristic allows traders to achieve higher returns while risking relatively smaller amounts, making the pattern especially attractive to traders seeking trades with favorable probabilities.
The versatility of the Cup and Handle pattern also contributes significantly to its popularity. This pattern is effective across various financial instruments, including stocks, commodities, cryptocurrencies, and forex pairs, providing ample opportunities for traders regardless of their preferred market. Furthermore, its applicability spans multiple trading horizons, from short-term intraday charts to long-term multi-year patterns, accommodating diverse trading styles ranging from day trading to long-term investing.
Additionally, the Cup and Handle pattern aligns well with other forms of technical analysis, allowing traders to integrate it seamlessly into broader trading strategies. When combined with other indicators such as moving averages, volume analysis, or oscillators like the RSI, traders can significantly enhance the reliability of their trade signals, minimizing false breakouts and improving overall trading outcomes.
Moreover, due to its well-defined structure, the Cup and Handle pattern helps traders maintain discipline in their trading strategy, reducing impulsive decisions. Traders who rely on patterns with clear guidelines tend to experience greater consistency in their performance, as they are less likely to be influenced by emotional fluctuations driven by short-term market volatility.
Lastly, when identified correctly, the Cup and Handle pattern can predict significant price moves, potentially providing substantial profits. As the breakout from the handle usually triggers renewed investor interest, traders frequently experience strong momentum and a quick realization of profits, enhancing their trading efficiency and capital utilization.
🔗 indicate
What Does a Cup and Handle Pattern Indicate?
The Cup and Handle pattern signals a period in which market sentiment transitions from uncertainty or mild bearishness to renewed bullish optimism. Initially, the pattern emerges after a robust upward trend, when traders begin to take profits, causing the price to consolidate and form a rounded, U-shaped bottom. This rounded formation reflects a gradual shift in market sentiment, as selling pressure slowly diminishes and buyers begin to accumulate the asset at lower price levels.
After forming the cup, prices often face resistance at their previous highs, leading to another brief period of consolidation known as the handle. This second phase symbolizes a temporary pullback or sideways movement as short-term traders hesitate or lock in quick profits, unsure if the asset can break through the established resistance.
Ultimately, a successful Cup and Handle pattern signals the re-emergence of buying momentum and investor confidence. When prices finally break above the handle’s resistance with increased trading volume, it confirms that bullish sentiment has overtaken selling pressure. This breakout typically initiates the continuation of the previous upward trend, indicating that prices are likely to advance higher in response to renewed buyer interest. Traders interpret this pattern as a reliable signal that a new rally phase is starting, allowing them to strategically position themselves to capture potential price gains.
For a visual explanation of the Cup and Handle pattern, you may watch this video.
How Do You Find a Cup and Handle Pattern?
Identifying a Cup and Handle pattern involves recognizing specific characteristics in a price chart:
Cup Formation:
Shape: A rounded, "U"-shaped bottom indicating a period of consolidation.
Depth: Ideally, the depth should be between 15% to 33% from the peak to the trough.
Duration: Typically forms over a period of 1 to 6 months.
Handle Formation:
Formation: Occurs after the cup, representing a short consolidation or slight pullback.
Depth: Should retrace about 30% to 50% of the cup's advance.
Duration: Usually lasts between 1 to 4 weeks.
🔗 types
Types of Cup and Handle Patterns
Understanding the variations of the Cup and Handle pattern can help traders recognize trading opportunities under diverse market conditions and timeframes. Although the basic principles remain consistent, each variant offers unique characteristics and challenges that traders should consider carefully.
1. Cup and Odd Handle
The Cup and Odd Handle variation occurs when the handle portion significantly deviates from the standard horizontal or slightly downward-sloping consolidation. In this scenario, the handle might exhibit a steeper decline or display an irregular, inconsistent shape, making it somewhat more challenging to identify clearly. Although this irregularity does not invalidate the pattern entirely, it does require additional caution. Traders should carefully validate such a pattern using other technical indicators, such as volume analysis, momentum oscillators, or trendlines, to confirm the strength and reliability of the expected breakout.
2. Multi-Year Cup and Handle
The Multi-Year Cup and Handle pattern represents an extended consolidation phase, often spanning several years rather than weeks or months. Due to its prolonged formation, this variant typically indicates a significant accumulation phase by institutional investors and can signal powerful long-term bullish movements once the breakout is confirmed. Although multi-year patterns can be highly profitable, traders must remain patient and disciplined, carefully monitoring developments over a longer time horizon. Such extensive patterns often lead to major price movements, making them especially attractive for long-term investors or position traders seeking substantial returns.
3. Intraday Cup and Handle
In contrast, the Intraday Cup and Handle pattern occurs on significantly shorter timeframes, such as hourly, 15-minute, or even 5-minute charts, providing opportunities primarily for day traders or short-term swing traders. This condensed timeframe demands rapid analysis and immediate decision-making, as patterns form and evolve quickly within a trading session. Due to the accelerated nature of intraday trading, traders must remain vigilant, closely watching volume fluctuations and price movements for timely breakout signals. Intraday traders often supplement this pattern recognition with additional short-term indicators, such as moving averages or volume spikes, to strengthen entry signals and minimize the risk of false breakouts.

🔗 volume
Volume During the Cup Formation
Volume plays a crucial role in validating the Cup and Handle pattern:
- Declining Volume: During the cup's formation, volume should decrease, reflecting diminishing selling pressure.
- Low Volume at Bottom: At the cup's bottom, volume typically remains low, indicating consolidation.
- Increasing Volume on Right Side: As the price ascends the right side of the cup, volume should increase, signaling renewed buying interest.
- Surge During Breakout: A significant volume spike during the breakout above the handle's resistance confirms the pattern's validity.
🔗 reversal
What Is the Reversal Downtrend for Cup and Handle Pattern?
While the Cup and Handle is inherently a bullish continuation pattern, certain conditions can lead to a reversal:
- Failed Breakout: If the price breaks above the handle's resistance but quickly reverses and falls below the pattern's low, it may signal a bearish reversal.
- High Handle Depth: A handle that retraces more than 50% of the cup's advance can indicate weakening bullish momentum, increasing the risk of a downtrend.
- Divergent Volume: If the breakout occurs on declining volume, it may lack the strength to sustain an uptrend, potentially leading to a reversal.
Understanding these reversal signals is crucial for effective risk management.
Common Mistakes to Avoid
When trading the Cup and Handle pattern, be mindful of these common pitfalls:
- Misidentifying the Pattern: Ensure the formation meets the specific criteria of a Cup and Handle, avoiding patterns that merely resemble it.
- Ignoring Volume: Disregarding volume trends can lead to false signals. Always confirm the pattern with appropriate volume behavior.
- Entering Prematurely: Wait for a confirmed breakout above the handle's resistance before entering a trade to reduce the risk of false breakouts.
- Neglecting Stop-Loss Orders: Failing to set stop-loss orders can result in significant losses if the trade moves against you.
- Overlooking Market Context: Consider the broader market trends and avoid trading the pattern in isolation without assessing overall market conditions.
By recognizing and avoiding these mistakes, traders can enhance the effectiveness of the Cup and Handle pattern in their trading strategies.
🔗 FAQ
Frequently Asked Questions (FAQ)
1. What makes the Cup and Handle pattern bullish?
The Cup and Handle pattern indicates bullish sentiment because it represents a shift from selling pressure to renewed buying interest. Once the price breaks out above the handle's resistance, it suggests strong upward momentum and continued buyer dominance.
2. How reliable is the Cup and Handle pattern?
While the Cup and Handle pattern is considered a strong indicator of a bullish continuation, its reliability increases when combined with other technical tools such as volume analysis, moving averages, or oscillators. It should not be used in isolation.
3. Can the Cup and Handle pattern fail?
Yes, like all trading patterns, the Cup and Handle can occasionally produce false breakouts. Traders should always use stop-loss orders and proper risk management techniques to minimize losses from potential pattern failures.
4. What timeframe is best for trading the Cup and Handle pattern?
The Cup and Handle pattern can appear on various timeframes, from intraday charts to multi-year charts. Its effectiveness depends on traders’ individual strategies and preferences, whether short-term day trading or long-term investing.
5. Can the Cup and Handle pattern form at the bottom of a downtrend?
Yes, the Cup and Handle pattern can occasionally appear at market bottoms, signaling a potential reversal from bearish to bullish sentiment. However, it is predominantly recognized as a continuation pattern within an existing bullish trend.
6. How important is volume in confirming a Cup and Handle pattern?
Volume plays a crucial role. Typically, volume should decrease during the cup’s formation, remain low in the handle, and significantly increase during the breakout. Proper volume confirmation helps validate the strength of the pattern.
7. What should I do if the price reverses after a breakout?
If the price quickly reverses following a breakout, triggering a stop-loss, it's best to exit promptly to limit losses. Re-evaluate the chart pattern and overall market conditions before considering re-entry.
திரும்பிச் செல்லவும் திரும்பிச் செல்லவும்
