Divergence is one of those market signals that many traders talk about, but few fully understand. Among the most intriguing forms is bullish divergence, a pattern where the price of an asset continues to fall, printing new lows, while an indicator like RSI or MACD quietly disagrees by showing higher lows. This mismatch between price action and momentum can be a subtle clue that sellers are losing steam and that a shift in control toward buyers may be around the corner. For traders who know how to spot it, bullish divergence offers a way to catch potential reversals before the crowd notices.
What makes bullish divergence so fascinating is not only the technical picture but also the psychology behind it. Prices may still look weak on the surface, drawing in sellers, but momentum indicators tell another story—the strength of the decline is fading. This tug of war between what the chart shows and what the indicators whisper adds depth to market analysis. When paired with smart risk management and confirmation tools, bullish divergence becomes more than a chart pattern; it becomes a strategic lens through which traders can see opportunities hidden in plain sight.
Table of Contents
Understanding Bullish Divergence
Identifying Bullish Divergence in Charts
How Bullish Divergence Works in Technical Analysis
How to Trade Bullish Divergence
Bullish Divergence vs. Bearish Divergence
Limitations and Risks of Relying on Bullish Divergence
Key Takeaways
- Bullish divergence suggests weakening downtrend momentum when price makes new lows but indicator doesn’t.
- Regular divergence often signals potential reversal; hidden divergence more about trend continuation after pullbacks.
- Common indicators used: RSI, MACD, Stochastic, sometimes others.
- Timeframes matter: higher timeframes give more reliable signals; shorter ones show more noise.
- Confirmation (price action, volume, support/resistance) is necessary to reduce risk of false signals.
- Managing risk (stop-loss, position sizing) is vital because divergence signals aren’t guarantees.
🔗 Understanding
Understanding Bullish Divergence
What is Bullish Divergence?
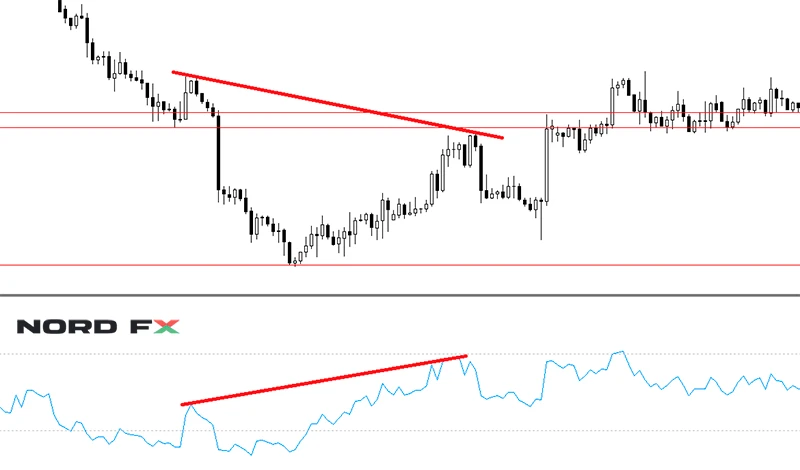
Bullish divergence is a technical signal. It occurs in a downtrend or when prices have been declining. The key is that while the price chart shows lower lows (the price is falling further), a momentum indicator—say RSI, MACD or stochastic—shows higher lows. The indicator is not confirming the depth of price decline; this mismatch (divergence) suggests that selling pressure or bearish momentum is fading.
There are variants:
- Regular bullish divergence: price makes lower low, indicator makes higher low. Suggests potential reversal from downtrend to uptrend.
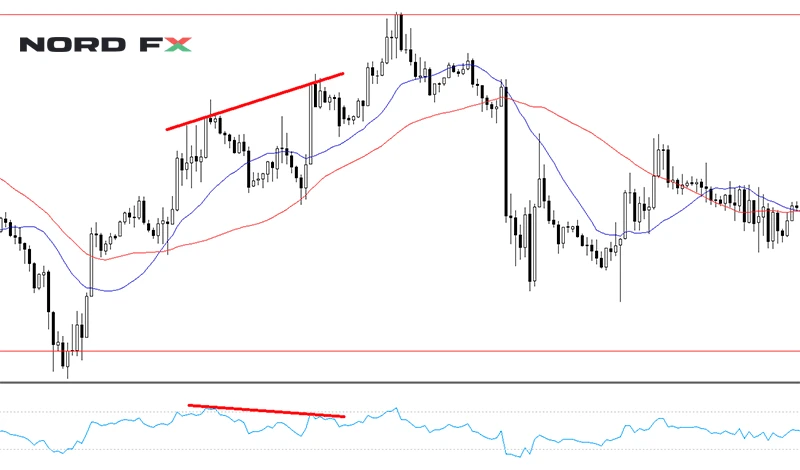
- Hidden bullish divergence: price makes higher low, indicator makes lower low. Suggests trend (if uptrend) is likely to continue after pullback or minor correction.
Types of Bullish Divergence (Regular, Hidden, etc.)
Type | Price pattern | Indicator pattern | Implication |
Regular Bullish Divergence | Lower low | Higher low | Potential trend reversal (down → up) |
Hidden Bullish Divergence | Higher low | Lower low | Continuation of existing uptrend after correction |
Strong vs Weak Divergence | The degree of separation or time between lows (price vs indicator) | How pronounced the divergence is in the indicator | Strong divergence gives higher confidence; weak divergence more prone to false signals |
Sometimes people also refer to extended, exaggerated divergence or “complex” forms where multiple lows or swings are involved, or divergence across multiple timeframes.
Common Indicators Used
Indicators most often used to detect bullish divergence include:
- Relative Strength Index (RSI)
- Moving Average Convergence Divergence (MACD) – lines or histogram can be compared to price lows.
- Stochastic Oscillator
- Others: Commodity Channel Index (CCI), on‐balance volume sometimes, or custom oscillators.
Each has its own characteristics in sensitivity, lag, false signals, and look‐ahead potential.
NordFX has articles on divergence (regular, hidden) including how RSI divergence is used.
Another NordFX resource talks about how the stochastic oscillator can show hidden bullish divergence when price forms higher low while stochastic makes a lower low.
🔗 Identifying
Identifying Bullish Divergence in Charts
Chart Structures & Candlestick Context
To identify bullish divergence one must look both at price action and indicator:
- Price side: look for lower lows (for regular divergence) or a pattern of swings. Note where support levels lie, whether price is touching or approaching a known support zone.
- Indicator: identify whether RSI / MACD etc. is forming higher lows while price is forming lower lows. For hidden divergence, look for higher lows on price vs lower lows on indicator.
Candlestick patterns, trendlines, support zones help confirm: e.g. you may see a bullish engulfing candle near a support zone where divergence appears.
Choosing Timeframes
Timeframe plays a big role:
Timeframe | Pros | Cons |
Daily, Weekly | Less noise; more reliable signals; better for swing / position trading | Later signals; slower entries; fewer setups |
4H, 1H | More trading opportunities; faster potential profits | More false positives; more noise; more whipsaws |
Lower than 1H (e.g. M15, M5) | Good for scalping; quick signals | Very noisy; high risk of false divergence; unreliable without confirmation |
Most traders prefer to confirm divergence on a higher timeframe before entering on a lower one (multi‐timeframe confirmation).
Real Examples & Patterns
Real examples help cement how to spot divergence.
For instance, price of an asset forms two successive lows: the second low is lower than the first. Meanwhile, RSI forms two lows but the second low is higher than the first.
Also look for hidden bullish divergence: price forming a higher low, indicator forming a lower low, which indicates the down‐pullback is shallow relative to momentum, possibly leading to trend continuation.
Graphs / chart screenshots are useful. (In practice, you’d overlay indicator windows below price, mark the highs/lows, draw trendlines through indicator lows, maybe draw support.)
🔗 Technical
How Bullish Divergence Works in Technical Analysis
Momentum indicators measure speed or rate of change, not absolute price. When price makes a lower low, but momentum indicator does not, this implies that pace of decline or bearish pressure is less than in previous swings—even if price continues downward. That means sellers may be drying up, or buyers are stepping in earlier.
Also, because indicators smooth or lag (depending on type), divergence can happen ahead of price turning.
Psychological / Market Behaviour Behind It
- Sellers who drove price down earlier are less aggressive or becoming exhausted.
- Buyers may start accumulating near support.
- Market sentiment may shift: news, fundamentals might ease bearish pressure, or buyers conclude downside risk is less.
- Often institutional or larger players notice divergence and begin positioning, producing early hints of reversal.
Relationship with Trend, Support & Resistance
Bullish divergence is more meaningful:
- Near established support zones or historical lows.
- When price is in a downtrend that has been persistent.
- If there is resistance overhead that may become a target.
- When trendlines or moving averages are in proximity—these provide structural context and confluence.
In NordFX discussion of divergence, it’s emphasized that divergence should be read together with trend, with market structure.
🔗 Trade
How to Trade Bullish Divergence
To trade bullish divergence, you generally want confirmation beyond just the divergence:
- Wait for price to show reaction: e.g. a bullish candlestick pattern (hammer, engulfing, etc.) at or near support.
- Look for indicator crossover (if using MACD, e.g. MACD line crossing above signal line) after divergence sets in.
- Volume confirmation: rising volume on bullish move after divergence.
- Possibly a retest: price might bounce or test support/resistance post-divergence before trending.
You might combine patterns. Example: divergence + morning star pattern near support to increase confidence. NordFX in its morning star article suggests checking if RSI is showing oversold levels or bullish divergence as additional confirmation.
Stop‐Loss, Take‐Profit Strategies
- Place stop-loss just below recent swing low (for regular divergence) or below support zone.
- Use risk‐reward ratios (e.g. 1:2 or 1:3).
- Take profit targets might be set at next resistance zones, trendline, or based on measured move.
Sometimes, partial profit-taking is used: e.g. lock some gains early, let rest run.
Combining with Other Tools / Indicators
- Use RSI, MACD, stochastic together or in combination to cross-check divergence signals.
- Look at trendlines and support/resistance to understand structure.
- Use moving averages to see overall trend direction. For example: only trade bullish divergence if price is above a long‐term moving average, or trend is bullish on higher timeframe.
- Use multi‐timeframe confirmation: e.g. a divergence on daily chart gives you broader context; then enter on a 4H once you see confirmation.
Common Mistakes & Avoiding False Signals
Mistake | Why It Fails | How to Avoid |
Relying solely on indicator divergence | Divergence may persist without reversal; indicator lag causes false signals | Always use chart structure, support/resistance, candlestick confirmation, volume |
Using too low timeframe | Noise, frequent whipsaws, false divergence | Prefer higher timeframes; do confirmation on those |
Ignoring trend direction | If trend is strongly down, bullish divergence may still fail as reversal | Trade with trend context; consider hidden divergence for continuation rather than reversal |
Poor stop‐loss placement | Can lead to big losses if market moves further down before reversal | Set stops at logical levels; keep position sizing tight |
Overtrading divergence signals | Many divergence signals appear; not all are valid | Filter by strength; use confluence; wait for confirmation |
🔗 vs
Bullish Divergence vs. Bearish Divergence
When studying divergence in technical analysis, it’s helpful to compare bullish divergence and its counterpart, bearish divergence. They are mirror images in many ways, but with different implications, usage, strengths, and pitfalls.
What is Bearish Divergence?
Bearish divergence happens when price exhibits higher highs, but a momentum indicator (RSI, MACD, Stochastic, etc.) shows lower highs. In effect, the price is continuing upward, making new peaks, but the indicator is failing to keep up. That suggests that upward momentum is weakening or exhausting.
There are also regular bearish divergence (indicating possible reversal from an uptrend) and hidden bearish divergence (suggesting that downtrend may continue after a retracement).
Key Differences in Pattern & Implication
Feature | Bullish Divergence | Bearish Divergence |
Price action base | Price making lower lows while indicator makes higher lows (regular divergence) or price makes higher lows while indicator makes lower lows (hidden) | Price making higher highs while indicator makes lower highs (regular) or price makes lower highs while indicator makes higher highs (hidden) |
Primary implication | Potential reversal upward (end of downtrend) or continuation via hidden divergence if already in uptrend | Potential reversal downward (end of uptrend) or continuation via hidden divergence if in downtrend |
Best context | When price is near support, oversold areas, or after a strong down move; lower timeframe signals benefit from higher timeframe confirmation | When price is near resistance, overbought areas, or after strong up move; again, confirmation helps |
Risk dynamics | Potential for false signals if trend remains strong; price may continue lower before reversing; timing uncertain | Same kinds of risk: trend may continue upward, or reversal may be delayed; false positives common especially in strong uptrends or volatility |
Which is More Reliable — Bullish or Bearish?
It’s not that one is inherently more reliable than the other; reliability depends on context:
- The strength of the trend preceding the divergence: strong trends may suppress reversal signals, making divergence less effective until a clearer sign emerges.
- The timeframe: divergence on higher timeframes (daily, weekly) tends to be more reliable. Lower timeframes produce more noise and false signals.
- The indicator used: some indicators lag more, some are more prone to false divergence signals. MACD, for example, may give many divergence signals that don’t play out.
- The presence of contextual confirmation: support/resistance, candlestick patterns, volume, trend lines. Divergence alone is often insufficient.
Use Cases: When to Use Bullish vs Bearish Divergence
- If you are looking for opportunities to go long or anticipate reversals in falling markets → bullish divergence.
- If you are looking to exit long positions, enter short positions, or hedge during rising markets → bearish divergence.
- Hidden divergence (both bullish and bearish) is more useful when staying with the trend, e.g. entering on pullbacks rather than trying to pick tops/bottoms.
Examples in Indicators
- RSI divergence: bullish RSI divergence when RSI makes higher lows while price makes lower lows; bearish RSI divergence when price makes higher highs but RSI fails to.
- MACD divergence: similar pattern; using MACD line or histogram vs price. MACD has both bullish and bearish divergence signals.
🔗 Risks
Limitations and Risks of Relying on Bullish Divergence
While bullish divergence is a powerful tool, there are many limitations and risks traders should be aware of. Using it naïvely can lead to losses, false hopes, or mis‐timed entries.
Common Limitations
- False Signals
Divergence does not guarantee a reversal. Markets often show divergence yet continue trending. In sideways, volatile, or choppy markets, divergence signals are far more likely to fail.
- Uncertain Timing
Even when divergence is valid, it gives little indication of when the reversal will happen. There could be a long delay. Traders acting too early may suffer drawdowns before the move occurs.
- Subjectivity in Identification
What counts as a “low”, “high”, “significant swing”? Different traders draw different swing points. Minor price fluctuations can mislead. The definition of higher low/higher high can vary.
- Lagging Nature of Indicators
Momentum indicators compute over past data. By the time divergence is visible, part of the move may have already happened. Sometimes price action is already reversing by the time indicator divergence is clear.
- Trend Strength & Overpowering Forces
In very strong downtrends, seller momentum may still be dominant despite divergence; divergence may persist without reversal. Also macro factors, news, sentiment, liquidity may overwhelm technical divergence signals.
- Noise & Market Conditions
High volatility, news, gaps, low liquidity can generate spurious divergence signals. Divergence may appear on low volume or on charts with gaps and be ignored or misread.
Practical Risks for Traders
- Entering too early / premature trades
A trader sees bullish divergence, enters long, but price continues downward more before turning upward – can hit stop‐loss or lose capital.
- Poor risk management
Without disciplined stop loss, position sizing, traders can be hurt when divergence fails.
- Overreliance on divergence alone
Ignoring context (trend, volume, chart structure) increases probability of loss.
- Emotional bias
Traders hoping for reversals may see divergence that isn’t strong just because they want to enter long; confirmation bias.
- Whipsaws and false breaks
After divergence, price might bounce, then reverse back, triggering stop losses.
How to Mitigate the Risks
- Use multiple indicators and confirmations: volume, candlestick patterns, support/resistance, trendlines.
- Favor higher timeframe signals for more weight.
- Wait for some confirmation after divergence: e.g. bullish candle pattern, indicator crossover.
- Set sensible stop‐losses, define target levels.
- Use risk/reward ratios.
- Avoid trading divergence signals during known high‐volatility events (e.g. major announcements) unless you have superior edge.
- Backtest your approach on the particular market/instrument you trade to understand how divergence signals tend to behave there.
🔗 FAQs
FAQs
Here are some frequently asked questions about bullish divergence, bearish divergence, and the practicalities of using them.
Question | Answer |
What is the difference between regular divergence and hidden divergence? | Regular divergence signals possible trend reversal: price lows or highs diverge from indicator lows or highs. Hidden divergence signals trend continuation: price retraces but indicator shows underlying strength or weakness. |
Does bullish divergence always lead to a price increase? | No. Bullish divergence suggests weakening of downward momentum and possibility of upward move, but it is not guaranteed. It may fail, delay, or be insufficient to reverse trend. |
Can divergence be used on any timeframe? | Yes—but reliability improves on higher timeframes. On lower timeframes, signals are more frequent but more often false. It helps to cross‐check higher timeframe. |
Which indicators are best for spotting divergence? | Common ones are RSI, MACD (line, histogram, signal line), Stochastic oscillator. Each has pros and cons. Using more than one, plus price action and volume, helps. |
How should I set stop‐loss and take profit when trading divergence? | Stop‐loss often placed just beyond recent swing low (for bullish divergence) or high (for bearish). Take profit may be next significant resistance (or support for bearish), or measured from swing height. Use sensible risk reward ratios (e.g. 1:2 or more). |
What are false divergence signals and why do they happen? | False divergence signals occur when divergence appears (price vs indicator mismatch), but price does not reverse or move significantly. They happen due to market noise, strong trend momentum continuing, low volume, or misidentification of swing points. |
Is divergence more reliable in some markets/assets than others? | Yes. Markets with clear trends and liquidity tend to give more reliable divergence signals (major forex pairs, large-cap stocks, commodities). Less liquid, highly manipulated, or very volatile assets can produce more false signals. |
How does bearish divergence relate to bullish divergence in risk? | Both carry risk of failing. Bearish divergence used to anticipate reversals downwards, but if trend is strong or market sentiment remains extremely bullish, the price may continue up long enough to hurt traders who act too early. Similarly for bullish divergence in strong downtrends or during negative fundamentals. |
Can divergence signals be combined with other technical tools? | Yes. Best practice is to combine divergence with support/resistance levels, trendlines, candlestick patterns, moving averages, volume analysis, or even macro/fundamental context. This reduces reliance on any one weak signal. |

